Running the Position Funding Cube

   Overview   

The Data Warehouse contains the Position Funding Cube, which provides payroll expense details and encumbrance amounts by chartstring by employee. The report can be used as a personal services detail or payroll cost report. The cube includes Payroll Actuals from 7/1/2018-12/31/2018 data that has been added from legacy systems.

In this article, you will learn the steps to download and view the Position Funding Cube from the Data Warehouse.

Start by connecting to your VPN, then point your browser to dwreports.uga.edu . Follow the prompts to log in using your MyID and password.

1. Step 1

The Financial-HCM page is displayed with the Position Funding Cube link highlighted

First log into UGA Data Warehouse

After you have logged in, navigate to the cube using the following folders:

All UGA Faculty and Staff Reports > Financial-HCM

In the Excel Workbooks section, click the  Position_Funding_Cube.xlsx  link.

2. Step 2

The Downloads bar is displayed with the Open button highlighted

The Position_Funding_Cube.xlsx file is downloaded to your computer.

Click the Open button.

3. Step 3

The Position Funding Cube spreadsheet is displayed with the Enable Content button highlighted

If presented with a security warning, click the Enable Content button.

4. Step 4

The Row Labels cell is highlighted

Click the Row Labels cell to activate the PivotTable Fields.

5. Step 5

The PivotTables field menu is displayed with the Dept ID Descr UGADEPTBUDGRTP field and the Filters quadrant highlighted

The PivotTable Fields menu is displayed on the right side of the screen.  

To view data by department, scroll down and drag the Dept ID Descr UGADEPTBUDGRTP field to the FILTERS quadrant.

6. Step 6

The checkboxed Dept ID Descr UGADEPTBUDGRPT field and the FILTERS quadrant are highlighted

The Dept ID Descr UGADEPTBUDGRPT field is now displayed in the FILTERS quadrant and in the PivotTable Fields list with a checkmark.

7. Step 7

The drop-down list of the Dept ID Descr UGADEPTBUDGRPT All field is highlighted

The Dept ID Descr UGADEPTBUDGRPT field is also displayed on the report in Row 1 of the sheet as a filter applied to the data.

Click the drop-down list of the Dept ID Descr UGADEPTBUDGRPT   All   field to narrow down the data to a specific departmental tree.

Note : Selecting a specific tree will restrict the cube to only show data for this departmental tree.

8. Step 8

The Search Dept dialog box is displayed with the checkbox for the Select Multiple Items option highlighted

The Search Dept dialog box is displayed.

Click the checkbox for the Select Multiple Items option.

9. Step 9

The All tree icon is highlighted

Click the All  tree [+] icon to expand the tree.

10. Step 10

The All tree icon is highlighted

All the departments are displayed.

Deselect the All tree item by clicking the checkbox.

11. Step 11

The Expand button for the 00000000 - Departments tree item is highlighted

Click the [+] Expand button for the 00000000 - Departments  tree item.

12. Step 12

All the departments are highlighted

All the departments are displayed.

Select the department(s) for which you want to view data.

13. Step 13

The OK button is highlighted

Click the OK button.

14. Step 14

The selected department is highlighted in the Top Row

The selected department is displayed in the top row.

15. Step 15

The ACCOUNTING_DATE field is highlighted

The Budget Amount, Encumbrance Amount, and Actual Amount for the selected department(s) are displayed according to the Accounting Periods in column A.

Click and drag the ACCOUNTING_DATE field from the ROWS quadrant back to the PivotTable Fields to remove this data from the page.

16. Step 16

The PivotTables quadrants and the Pay Group Code Descr field are highlighted

The Accounting Date data is cleared from the page.

You can add additional fields to analyze your data by dragging the field to the appropriate quandrant (Filters, Columns, Rows, or Values).

Example shown here: Pay Group Code Descr field moved to the ROWS quadrant.

17. Step 17

The Row Label groups ad the PAY_END_DATE.Fiscal Date item are highlighted

The different pay groups are displayed in the Row Labels.

Drag the PAY_END_DATE.Fiscal Date item to the ROWS quadrant to view information by Pay End Date as well.

18. Step 18

The Plus icon for the FY1900-#NA field is highlighted

Click the [+] icon for the FY1900-#NA field to expand the tree to display the Fiscal Yr Acctg Pd data.

19. Step 19

The Tree Item for the FY1900-#NA field highlighted

The tree item is expanded. Right-click the item.

Example shown here: 1900-01-01 00:00:00.0000000 tree item.

20. Step 20

A pop-up menu is displayed with the Fiscal Year item highlighted

A pop-up menu is displayed. You can click Show/Hide Fields to show or hide any of the rows.

Example shown here: Show/Hide Fields > Fiscal Yr.

21. Step 21

A pop-up menu is displayed with the Fiscal Year Accounting Period item highlighted

Follow the same steps to show/hide any other data as needed.

Example shown here: Fiscal Yr Acctg Pd 

22. Step 22

The Name Emplid BadgeNo item and Rows quadrant are highlighted

The selected data is displayed.

Example shown here: view the information according to employee. 

In the PivotTable Fields, scroll down to drag the Name Emplid BadgeNo item under the EMPLOYEE field to the ROWS quadrant. This breaks down each Paygroup by Employee. 

23. Step 23

The More Fields tree item is highlighted

Pay Group data is displayed by Employee ID.

In the PivotTable Fields section, click the Expand button to expand the More Fields  tree item.

24. Step 24

The Fund Code Description tree item and the ROWS quadrant are highlighted

Drag the Fund Code Descr tree item to the ROWS quadrant.

25. Step 25

The More Fields tree item is highlighted

The information is now displayed by Fund Code.

Click the Expand button before the More Fields tree item.

26. Step 26

The GL Account ID Descr and the ROWS quadrant are highlighted

Scroll up and drag the GL Account ID Descr to the ROWS quadrant.

27. Step 27

The #NA Pay Group section is highlighted

The Cube now shows Payroll budget by Fund, Department, and Account Code.

Since Budget is not allocated by employee or pay date, the budget shows up under 1900-01-01 with an #NA Pay Group and Employee Name.

28. Step 28

Column B is highlighted

Column B shows the Budget Amount for each level: fund, department, and account.

29. Step 29

Column C is highlighted alongside an example pay group

Scroll down to view encumbrances (Column C) displayed by Pay Group, Employee, and Employee funding (Fund/Dept ID/Account Code).

Note : Because Encumbrances are not associated with a specific pay date, all the encumbrances show up under a paydate of 1900-01-01.

30. Step 30

An example pay date and Column C are highlighted

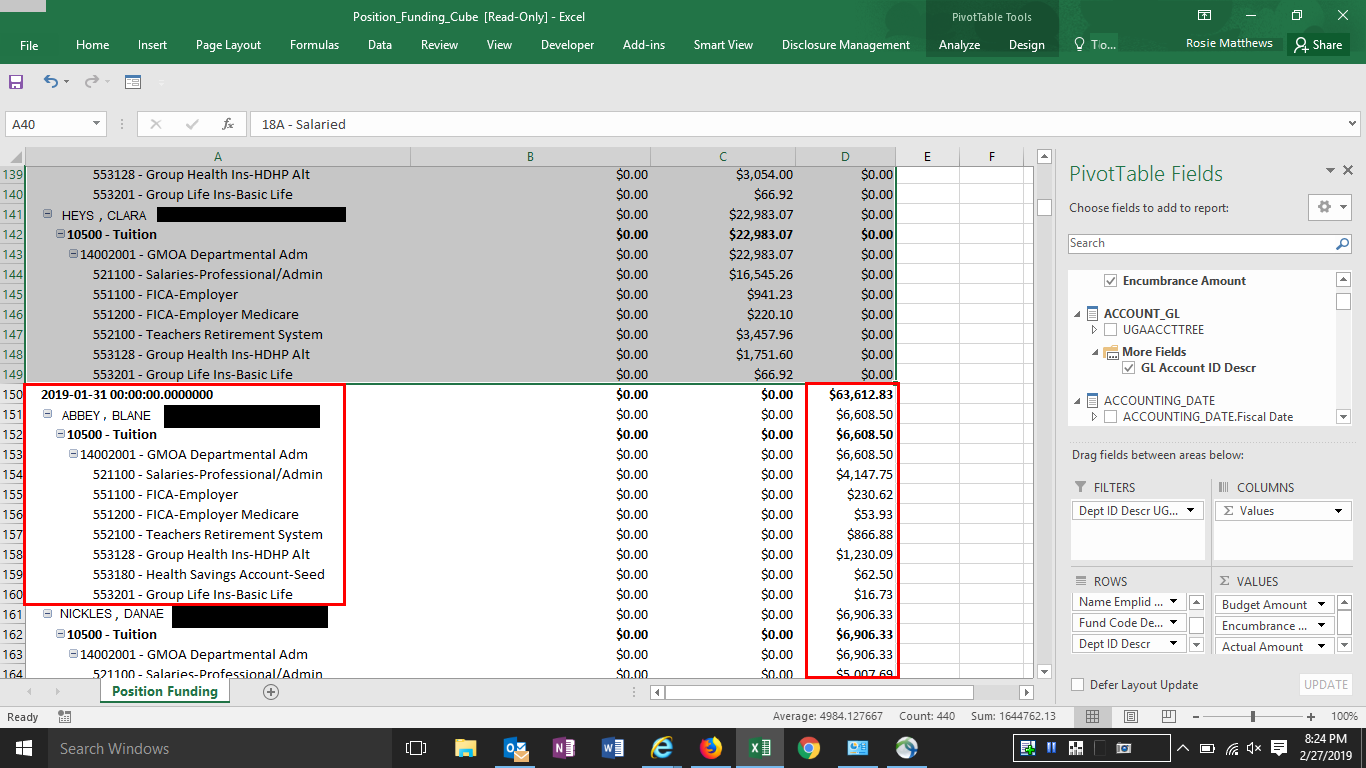
Scroll down to view data in the Actuals column (Column D). The Cube shows Actual Payroll totals by Pay Date. For each pay date, it shows the Actuals by Paygroup, Employee, and Employee funding (Fund/Dept ID/Account Code).

Additional Information:

Note: Currently, you must drill through on the Budget Amount of Encumbrance Amount fields. Drill through is not available on calculated fields like Actual Amount. However, drill through returns all values for the entire row related to Budget, Encumbrance, and Actuals.

Data in the Data Warehouse gets refreshed nightly. A best practice is to review filters on a regular basis to ensure you are pulling any new data your existing filters may exclude. Occasionally, new data elements are added which may create users impacts, requiring adjustmnts to repopulate data.

Tutorial Resources

Quick Start to the Position Funding Cube

Cube Field Definitions Quick Reference Guide

Lynda.com Training Resources